Running the People Engagement Demo

Starting the Demo Application
1. Configure the camera service: the configuration for the camera service is under 'config/camera in the demo folder. Read the Camera Service documentation for configuration options.
2. Configure the media service:The configuration for the media service is under 'config/media in the demo folder. Read the Media Service documentation for configuration options. Also, make sure the calibration.json file in the same directory is updated for your cameras.
3. Configure the Engagement Analytics Service:The configuration for the engagement analytics service is under 'config/engagement-analytics in the demo folder. Read the Engagement Analytics Service documentation for configuration options.
4. Configure the Display Service:For the Display service, make sure the DISPLAY variable in the .env file located in the root of the demo has the proper value for your board. To double-check, you can run the following command from a terminal in your board:
echo $DISPLAY
5. Start the application: Once everything is properly configured, run the following command from the demo folder to start the application:
docker compose up -d
This will launch and configure all the application services.
Demo Usage
Display Output
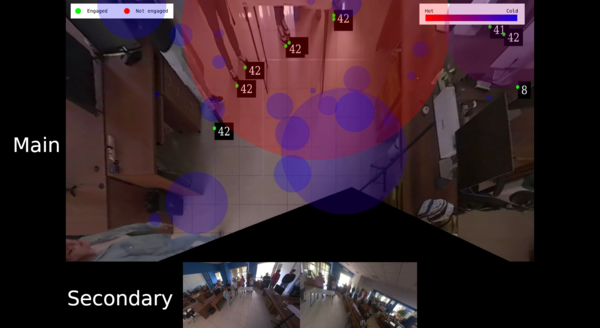
If you followed the previous steps to start the application, you should see a mosaic in your board's display showing the cameras and the BEV video with an overlay showing engagement status and a heatmap. It should look like this:

In the Main section, a bird’s-eye view (BEV) of the combined camera streams is shown. For each person, a green (engaged) or red (not engaged) dot is displayed, along with the duration of engagement in seconds. Additionally, a heatmap of engaged individuals is overlaid. The color of the circles represents the number of people, while the size of each circle corresponds to the area they occupied.
In the secondary view, the individual camera streams are shown.
Dashboard
The demo generates a Dashboard with engagement and visitor statistics. It can be accessed by entering the following address in a web browser:
HTTP://<board IP address>:3000
Once you enter the address, look for the GTC Attention dashboard; it should look like this:

In the dashboard you have the following controls:
1. Time Window: the time window that will be used to count visitors and engagement (i.e., how many engaged visitors have we had in the last Time Window).
2. Samples Period: On the top right corner of the window, you will see the samples period. Use it to configure the time period you want to observe (the last hour, the last day, ...).
3. Refresh rate: Right next to the samples period, you will see the Refresh Rate; use it to control how often the graphics will be updated.
Then you will see 6 panels with the following information:
- Visitors in a Time Window: How many unique visitors have been seen in the last Time Window. Each point in the graphic represents the number of unique visitors in the last Time Window.
- Engaged Visitors in a Time Window: How many unique Engaged visitors have been seen in the last Time Window. Each point in the graphic represents the number of unique engaged visitors in the last Time Window.
- Total Engagement in a Time Window: This is the total engagement in seconds in the last Time window. Each point represents the sum of the engagement of all the unique engaged visitors in the last Time Window.
- Average Engagement in a Time Window: This is the average engagement in seconds in the last Time window. Each point represents the average of the engagement of all the unique engaged visitors in the last Time Window.
- Number of Visitors Over Time: This is the number of unique visitors that have been seen in the configured Samples Period.
- Engaged Visitors Over Time: This is the number of unique engaged visitors that have been seen in the configured Samples Period.


